NJ Traffic Crash Data
The first 6 plots below come from NJ State Police fatal crash data (2008-present). It's generally current to the previous day.
Below that are plots of NJ DOT raw crash data, which includes 6MM property-damage, injury, and fatal crashes from 2001-2022. It's a richer dataset, but less up to date.
Work in progress map of NJDOT data: 5 years (2017-2021) of fatal and injury crashes in Hudson County:
- Full screen map here
- Code and cleaned data are here on GitHub.
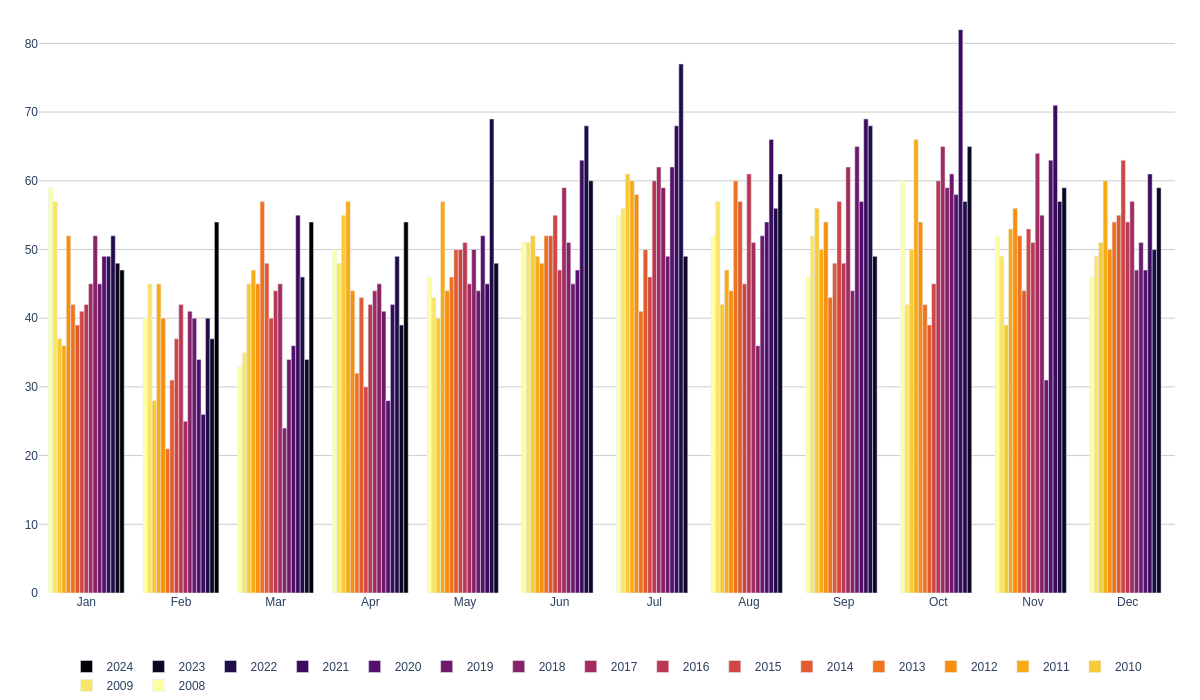
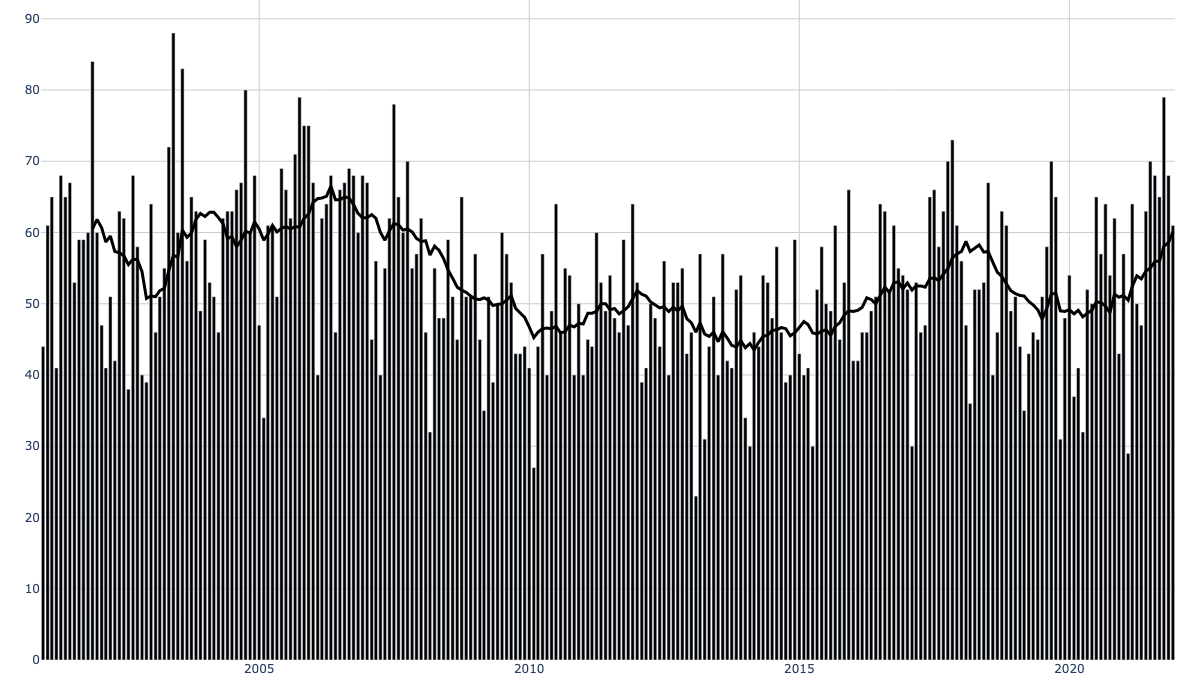
Car Crash Deaths:
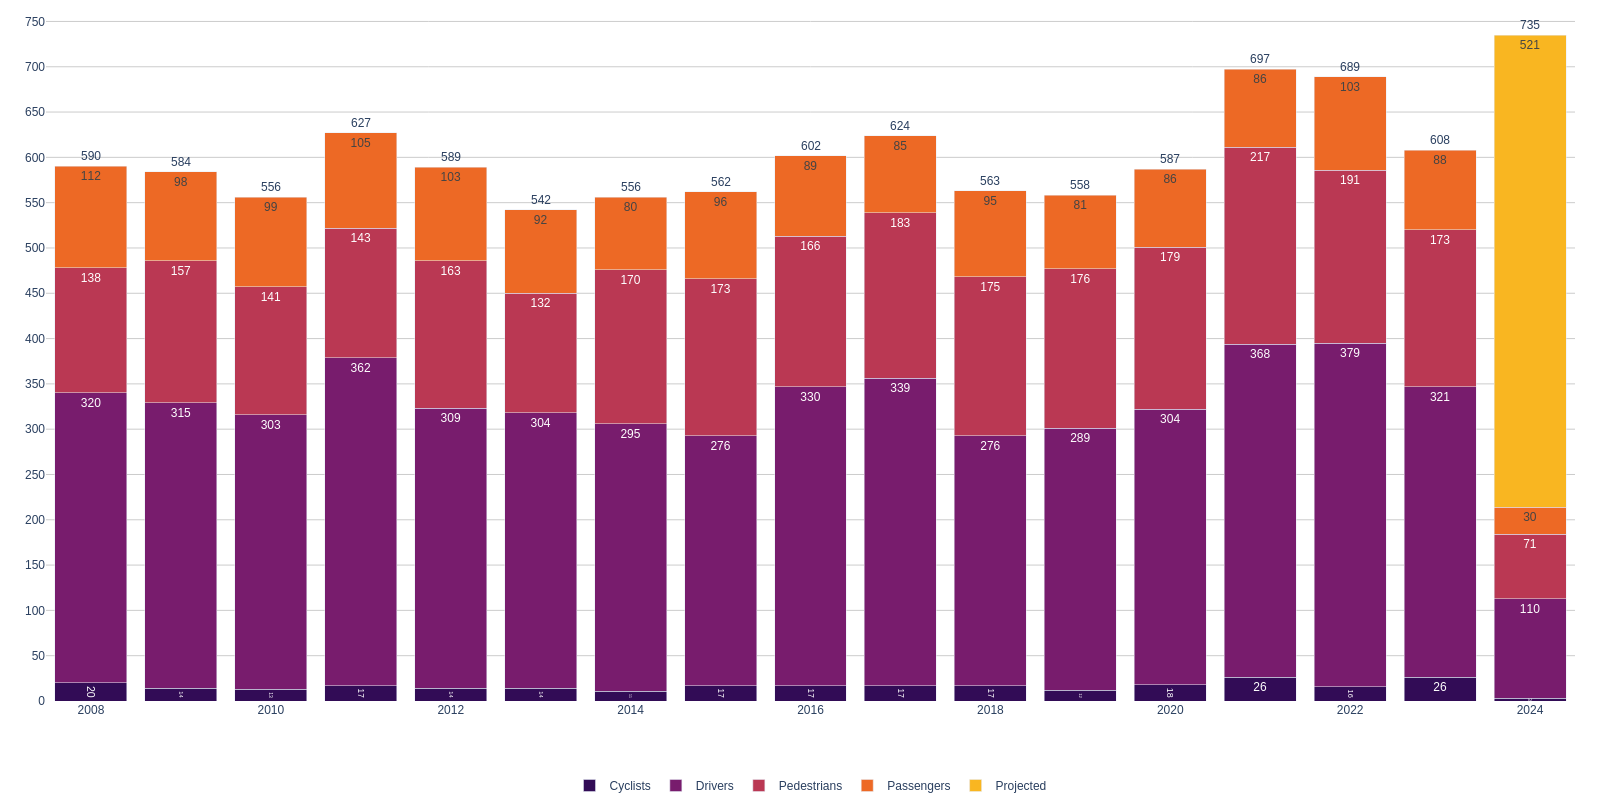
Click/Double-click the legend labels to toggle or solo each type.
As of Mar 13, NJ has 85 reported deaths in 2026, and is on pace for 566. More state-wide data.
2021 and 2022 were the worst years in the NJSP record (since 2008), with 697 and 689 deaths, resp.
Recent fatal crashes
| Date/Time | County | Municipality | Casualties | Location | |
|---|---|---|---|---|---|
| Tue Mar 10 10:45AM | Gloucester | Elk | Hardingville Rd | ||
| Tue Mar 10 8:27AM | Bergen | Hackensack | W. Pleasantview Ave | ||
| Tue Mar 10 7:25AM | Mercer | Ewing | State Highway 29 MP 7.56 | ||
| Mon Mar 9 9:57AM | Middlesex | Woodbridge | New Jersey Turnpike | ||
| Mon Mar 9 9:18AM | Essex | Newark | New Jersey Turnpike | ||
| Sat Mar 7 11:07PM | Ocean | Toms River | State Highway 9 | ||
| Sat Mar 7 5:57AM | Cumberland | Vineland | County 552 | ||
| Thu Mar 5 5:20PM | Monmouth | Wall | State Highway 70 | ||
| Thu Mar 5 1:57AM | Monmouth | Neptune | State Highway 35 | ||
| Wed Mar 4 8:36PM | Gloucester | Monroe | State Highway 322 MP 25.63 | ||
NJ Traffic Deaths vs. Homicides
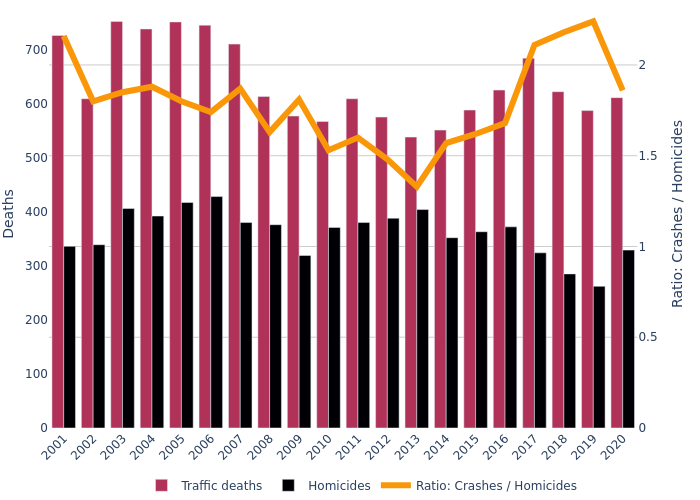
Car crashes kill twice as many people as homicides, in NJ.
In 2022, crashes killed 2.4x as many people, the largest disparity on record.
Homicide data comes from NJ State Police and Disaster Center.
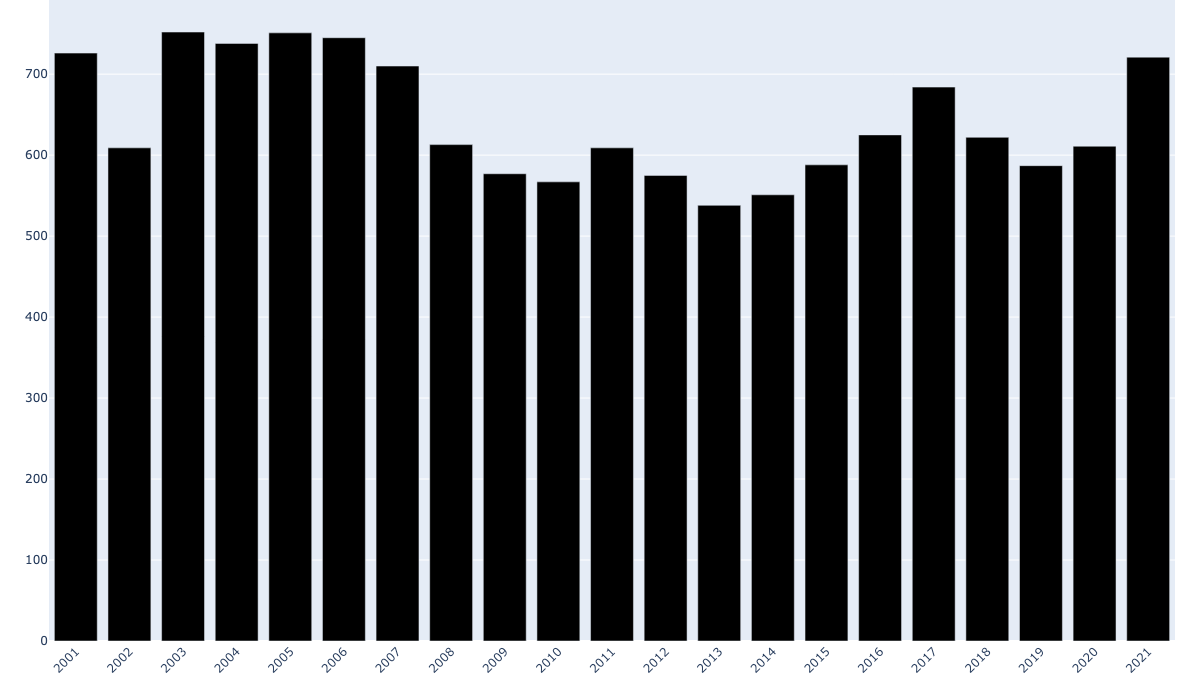
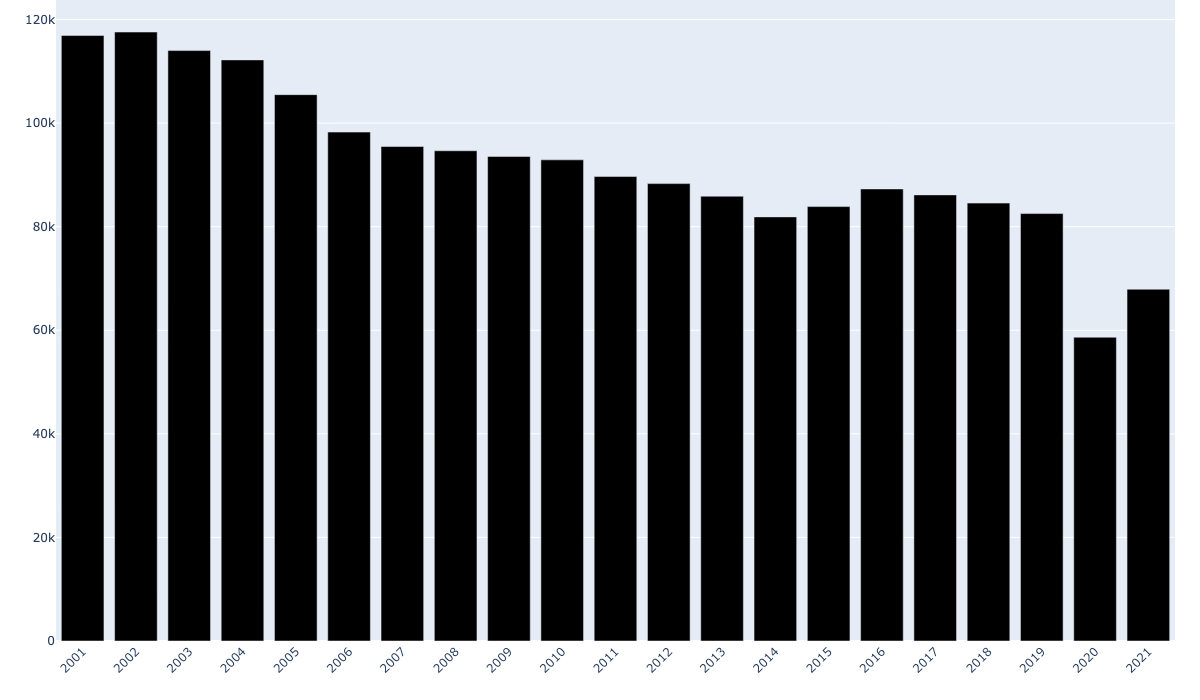
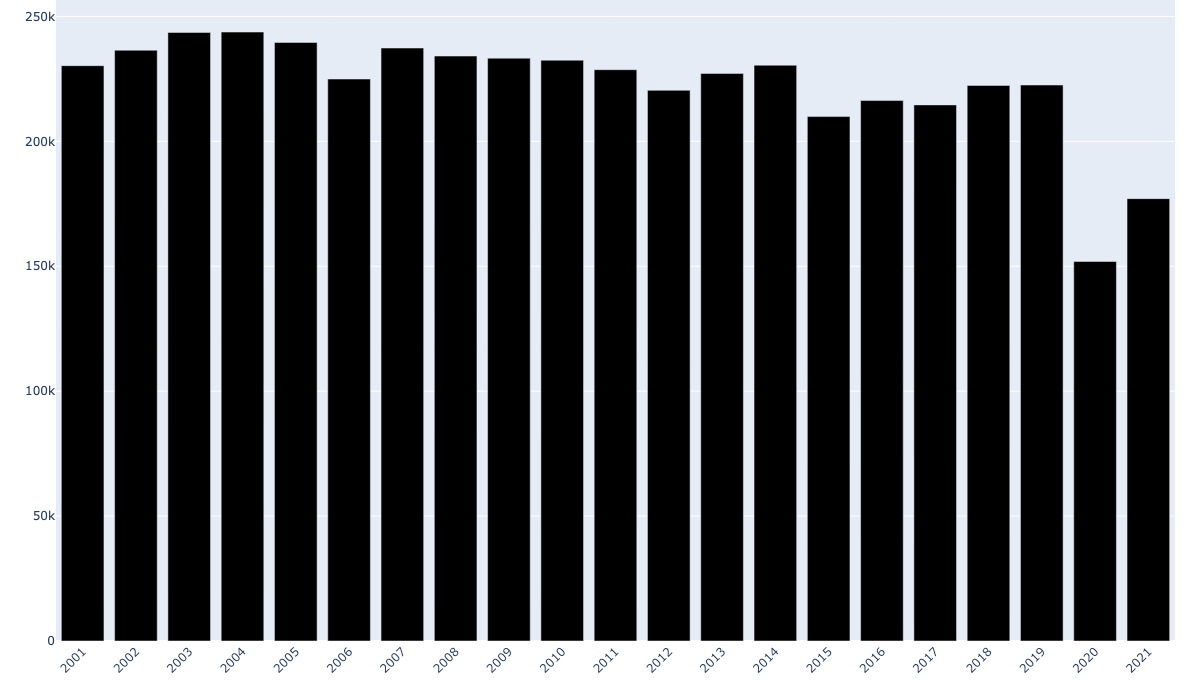
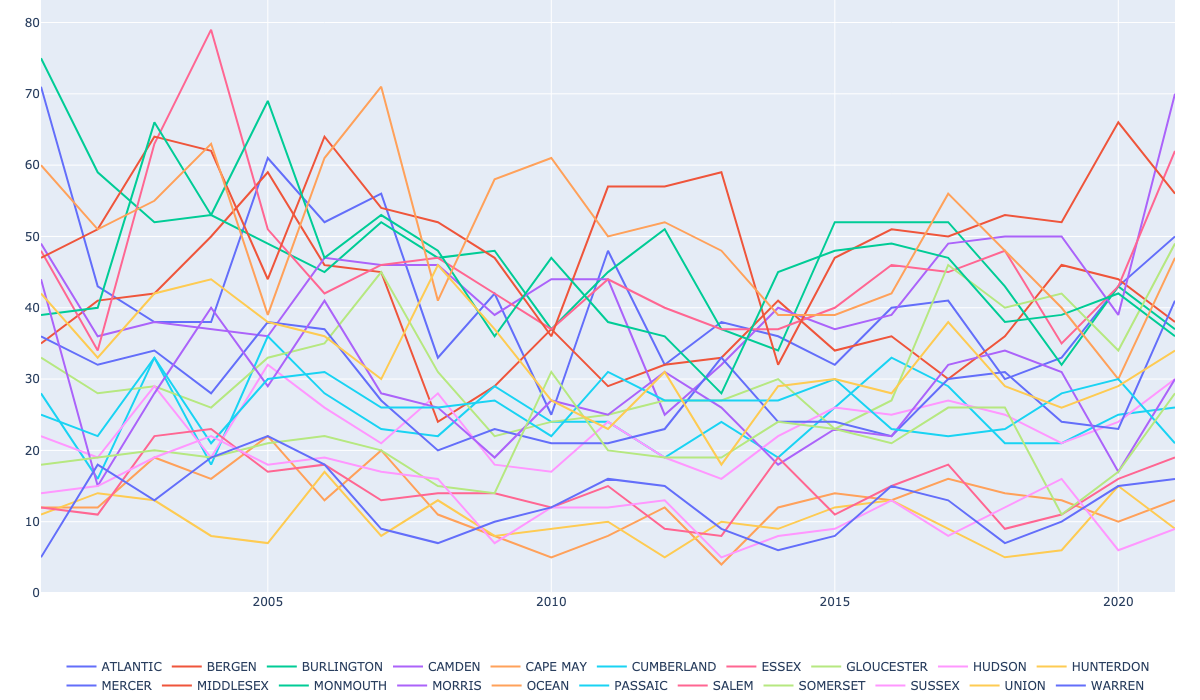
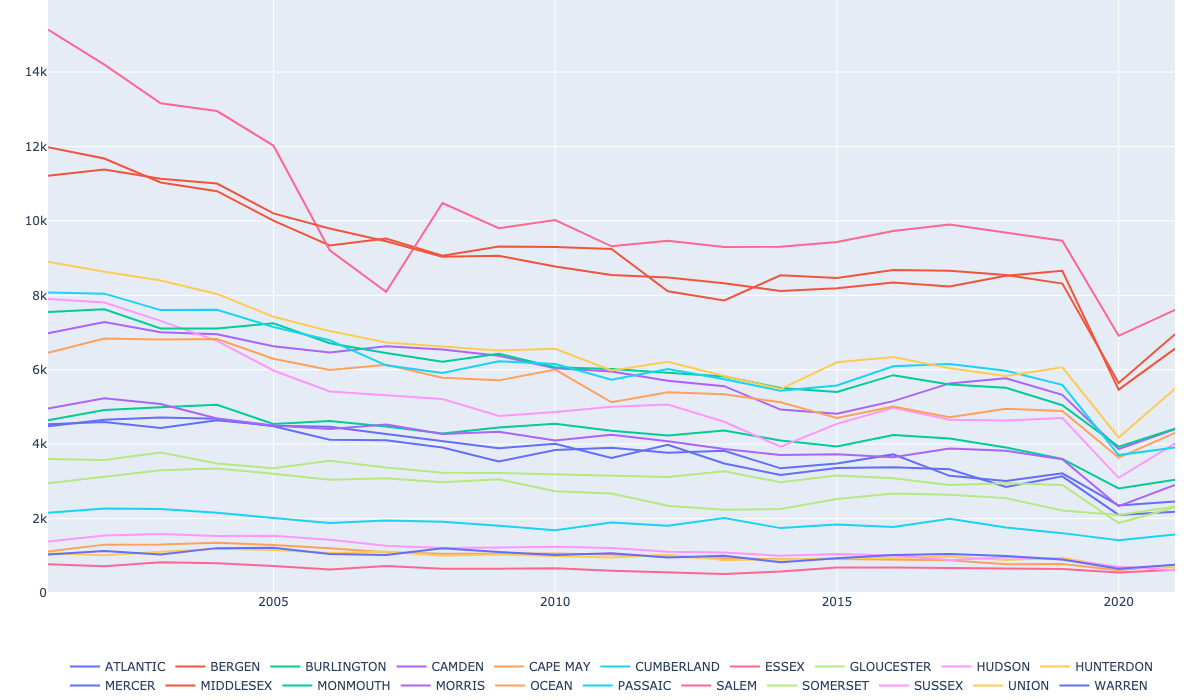
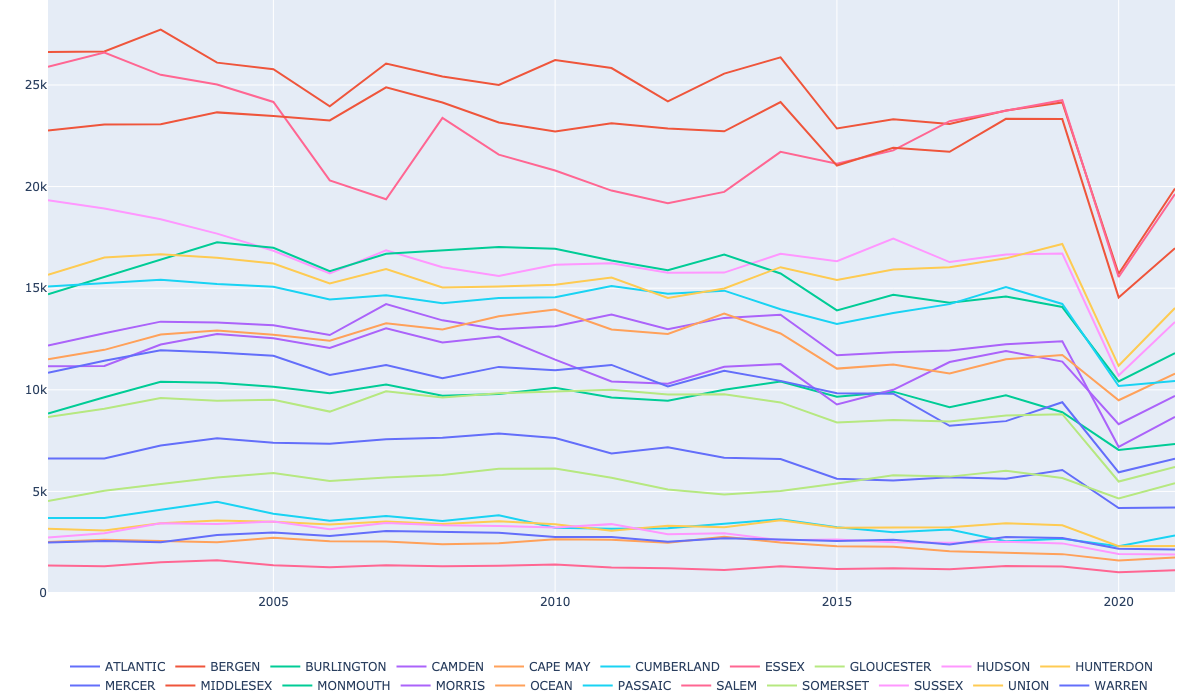
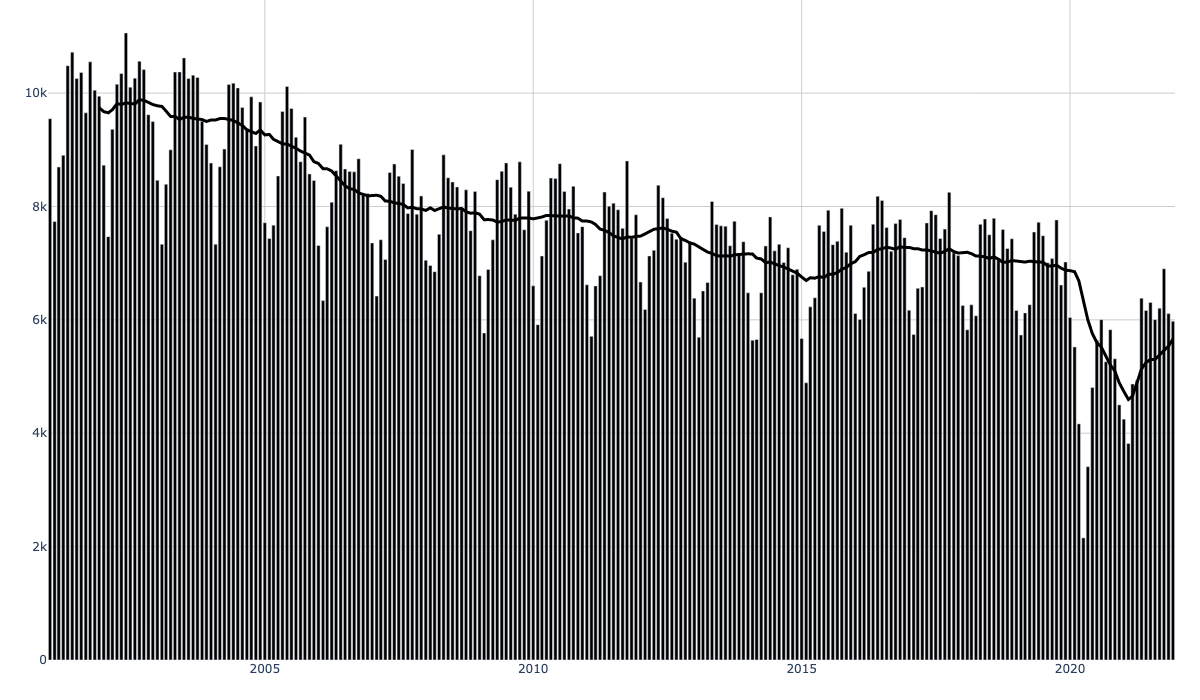
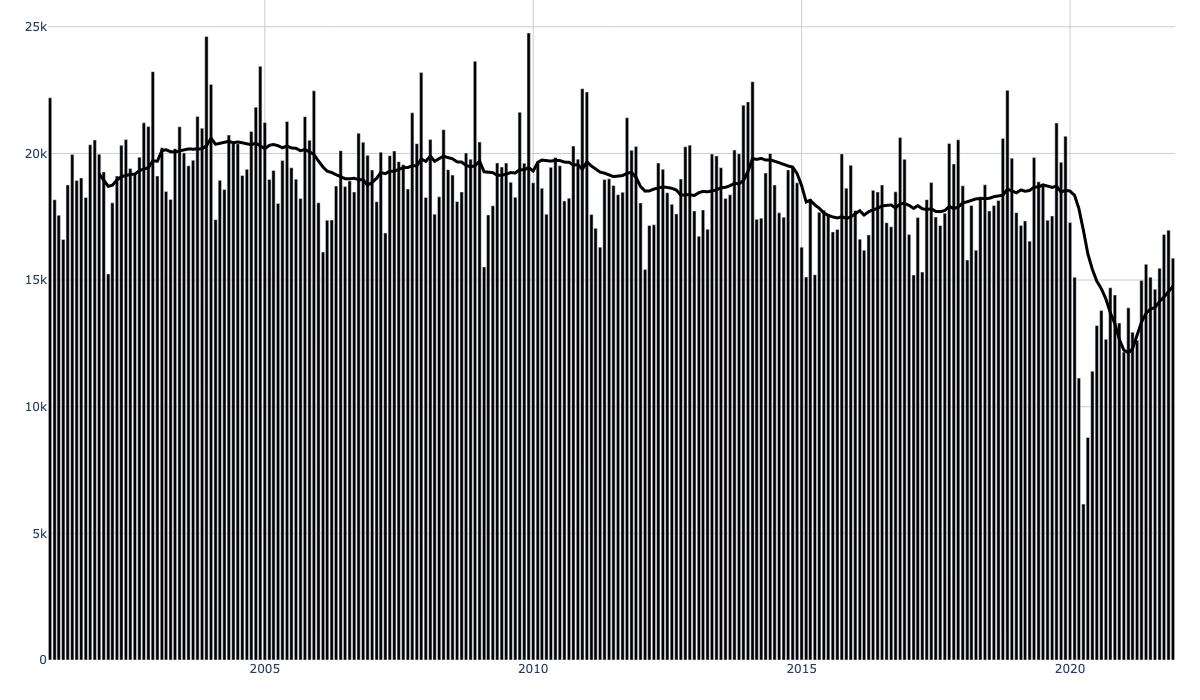
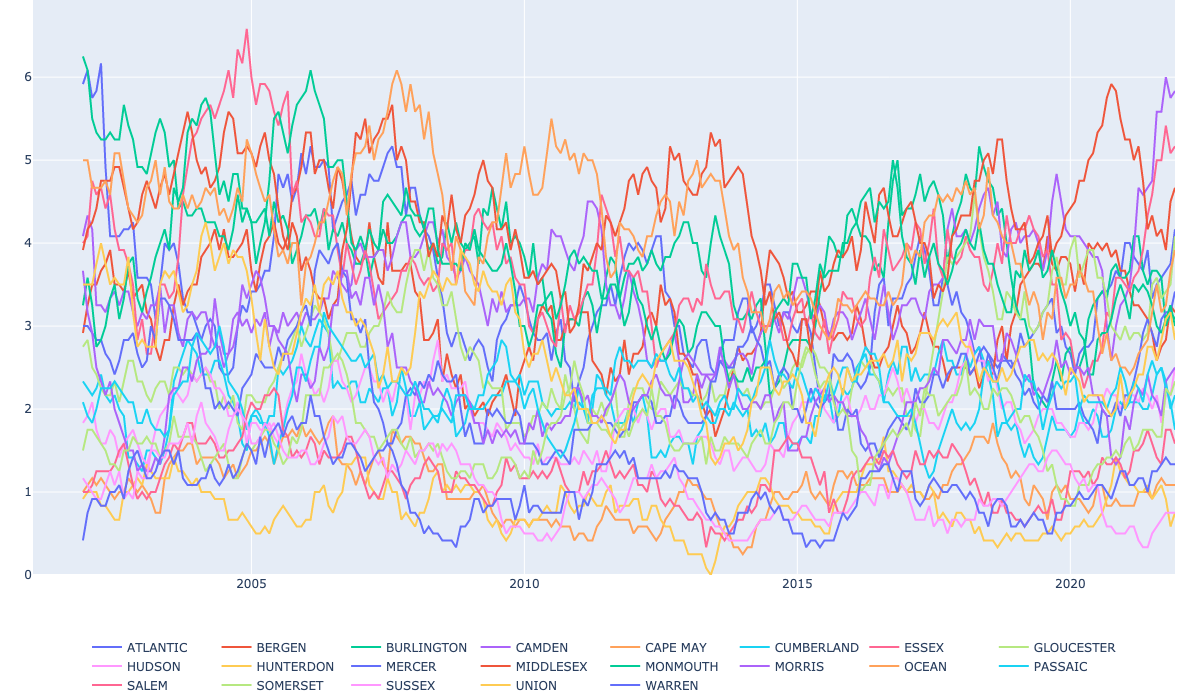
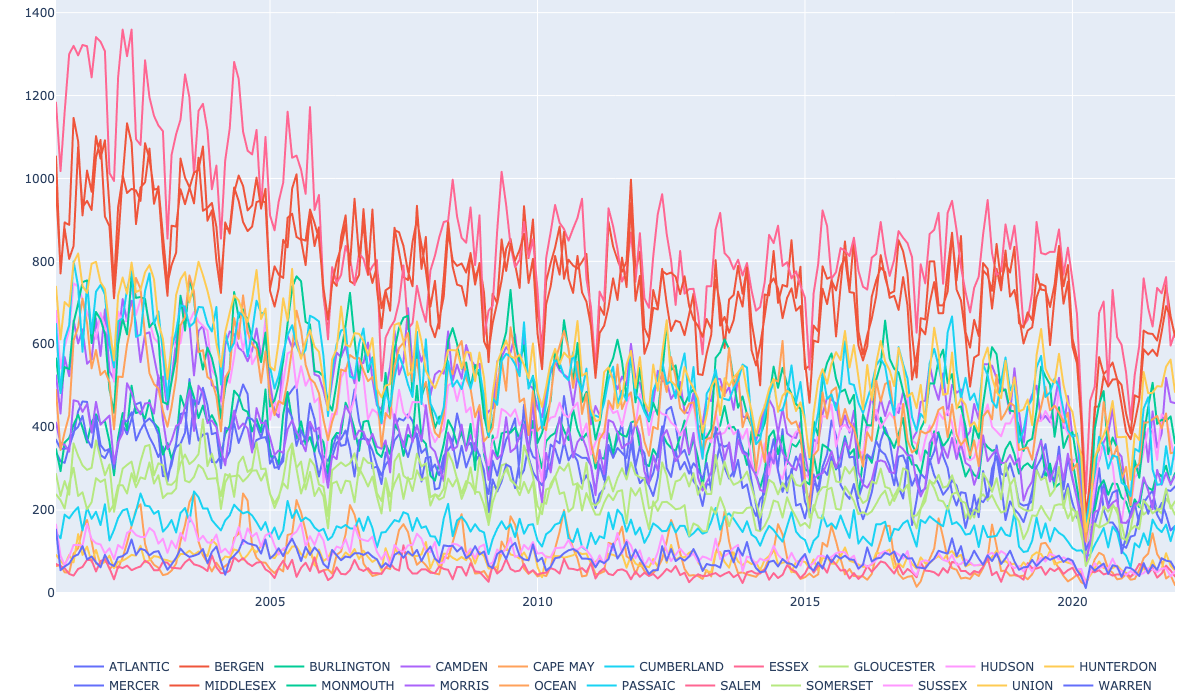
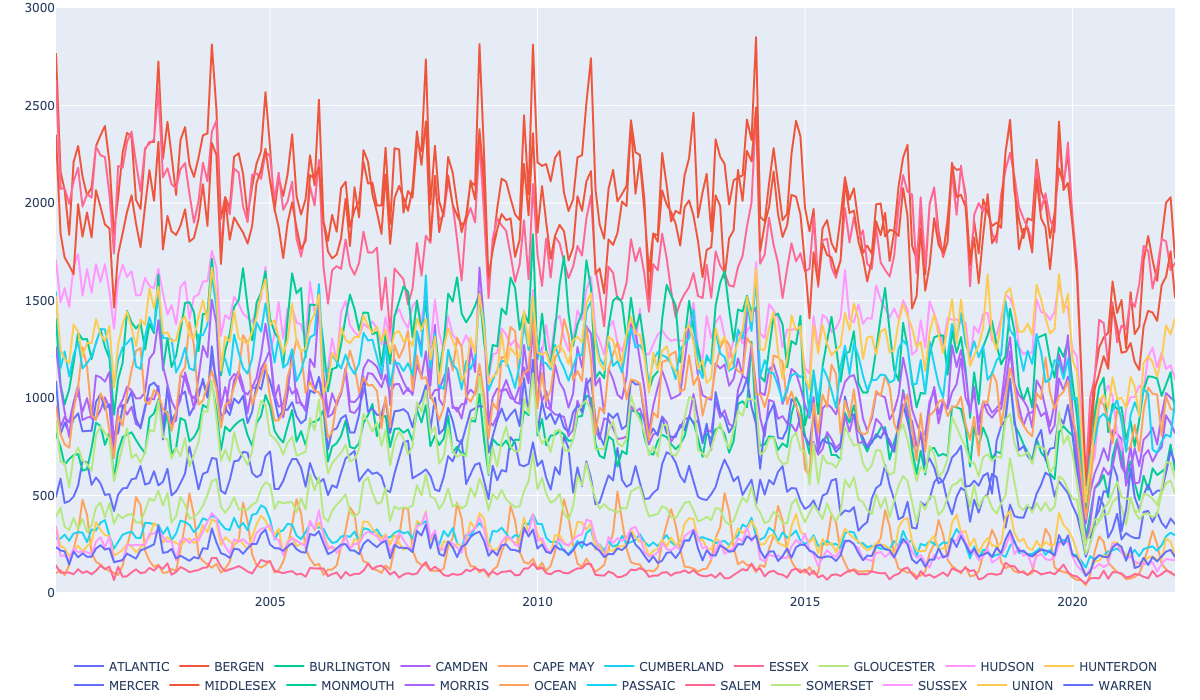
NJ DOT Raw Crash Data
NJ DOT publishes raw crash data, including property-damage, injury, and fatal crashes, going back to 2001 (≈6MM records).
Data is currently public through 2022, showing all crash types rebounding from COVID lows, and a particular spike in fatalities. 2023 data is expected in Fall 2025.
Code and data are on GitHub. File an issue, send us an email, or get involved.